|   Introduction & SummaryThe Performance of Your County Economy: How Does It Stack Up?Leading...or Lagging? Gaining...or Slipping?Stronger...or Weaker? Better...or Worse?"LSGL Analysis" is the moniker introduced on this Georgia Regional Economic Analysis Project website to characterize the technique we have adapted and borrowed from one appears in the weekend finance sections of the popular press. In the press, for example, one rendition of this approach compares and classifies the market performance of the 30 stock contain within the Dow over the past week, in contrast to their performance over the past month. The Dow's overall respective averages over the past week vs. the past month are the two key points of reference for judging the performance of the 30 individual securities comprising the Dow as Leading, Slipping, Gaining or Lagging. 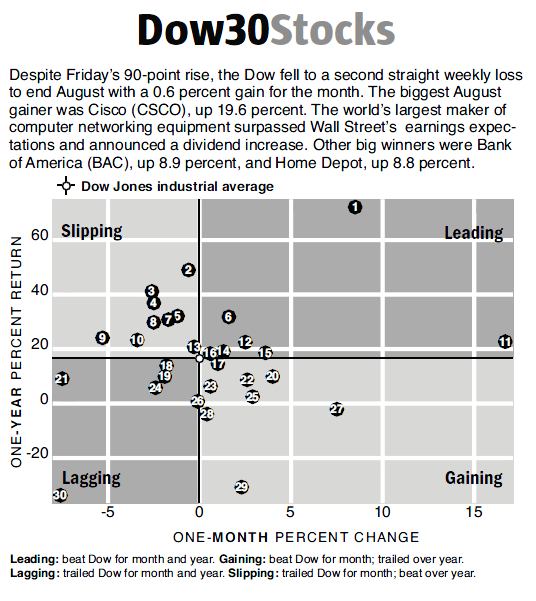 Source: "Dow30Stocks." Seattle Times 09 02 2012, Business D3. Directions
To compare and examine broad long-term trends of any of the 159 Georgia counties, enlist use of the interactive comparative trends analysis features at your disposal by clicking on the graph below. Warner Robins MSA Total Industry Earnings, 1969-2022  | Analysis Options Menu |